We have compiled a “toy problem” to showcase how estimating uncertainty to generate a simple probabilistic model helps you communicating the range of possible outcomes.
- You are planning a charity event for your kids’ school and want to figure out what the financial risk is, i.e., what is the likelihood that you lose money. You are also interested in the number written on the cheque you hope to pass to the school director.
- Two types of revenues are expected, sponsoring and ticket sales. You have expenses such as animations, prices, etc. (fixed cost) and expenses per participant (variable cost). Total revenue minus total cost is total benefit for your school.
- The amount of both revenues and expenses are uncertain, and of course the resulting benefits (if at all!) for the school. To get some idea about those financial uncertainties, let us make a little probabilistic exercise.

The first step to our uncertainty modelling is to analyze which parameters are impacting what we want to know and how they relate to each other. You set up a simple equation (the “Ariane’s Thread”) and then estimate the range of uncertainty for each of the variables (the Dancing Distributions).
The “Ariane’s Thread”
For the exercise, we have chosen to create a basic ArianeLogiX Thread with a simple logic (revenue minus cost equals benefit). Usually, ArianeLogiX Thread Points are not single parameters but a group of related equations with multiple variables. In our case there is no critical order, but often people intuitively start with positive parameters (earning money before spending it) – even though in business this is mostly the opposite!
Revenues
Revenues
Dancing Distributions
Each point of the ArianeLogiX Thread now needs to be described. Known (or thought to be known) parameters will be treated as constant values (e.g., ticket price) and uncertain parameters (e.g., number of participants) will be attributed a possible value range.
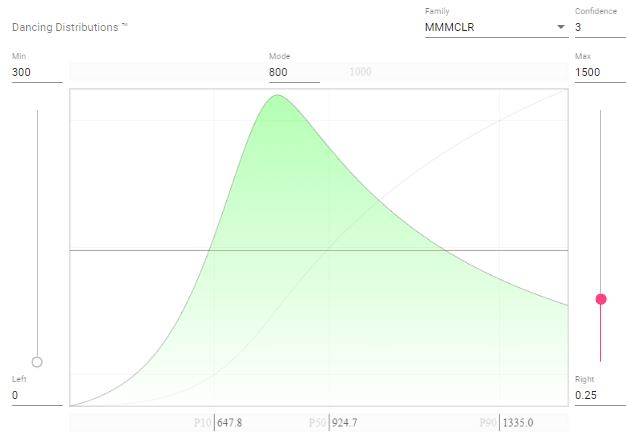
Sponsoring
- It is too early to be sure about how many sponsors will contribute to the event, and to what amount. At the moment there are only 300 EUR collected, but it is unlikely that it will remain that little. In the years before, there was an average of about 800 EUR. Often, sponsors can be convinced last minute, and if we do good marketing we might have up to 1500 EUR. There is actually a reasonable chance to achieve that goal. We must refuse any amount higher than that for legal reasons.
- This translates into a distribution with a minimum of 300, a mode of 800, and a maximum of 1500. The confidence is rather low, deflating the mode. The distribution is not tailing off towards the maximum amount because the likelihood is still relatively elevated.
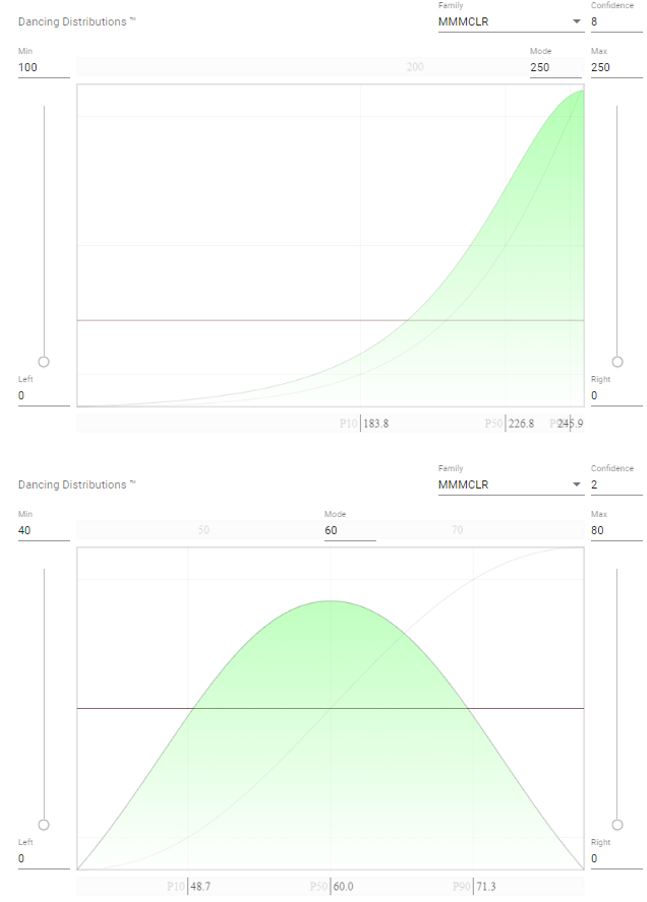
Ticket sales
- Other revenues will be generated from ticket sales. The full price is set to 10 EUR per participant, however, all the kids, elderly, sport team members etc. will pay only 5 EUR . Therefore, revenue by tickets sale will be the sum of participants paying full price multiplied by 10 EUR plus the other paying half price multiplied by 5 EUR.
- The school’s sports hall is limited to 300 people, which leaves a maximum of 250 paying participants if you deduct the organizers. Historically, you generally sold out the tickets on-site if the weather was ok. However, in the case of rain fewer people are expected. If fewer than 100 tickets sold one week before the event, it will be cancelled (and no expenses occur).
- The uncertainty distribution for the number of tickets sold (at both full and half price) starts with a very low probability at 100 and culminating at 250, which is both the mode and maximum tickets. Confidence is set to high based on previous events.
- Experience shows that in general, 3 out of 5 people will pay half price for various reasons. This uncertainty is described with a symmetrical distribution centered around 60% with 20% deviation. The confidence is rather low because the surveys of previous school parties did not report this level of detail.
Cost
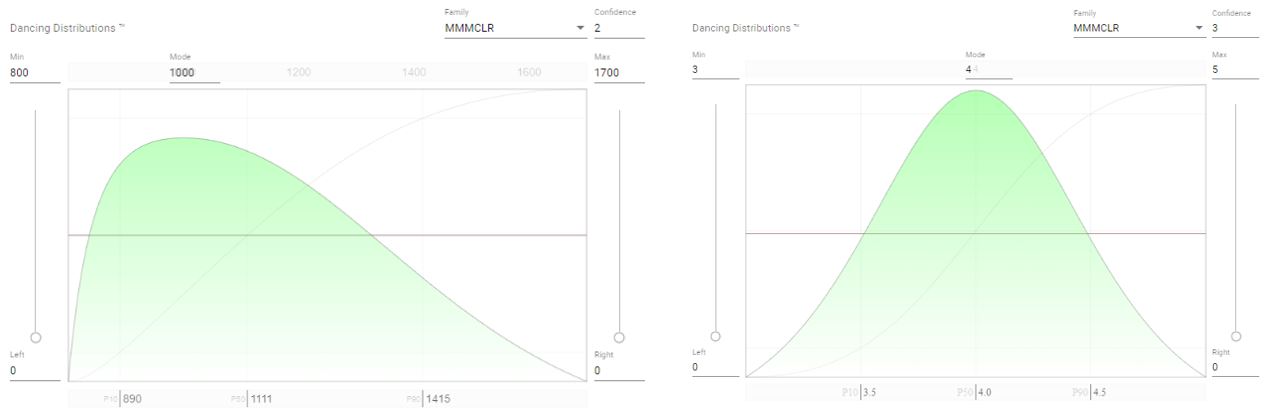
- Various groups of artists are on the wish list, there is still uncertainty about how many will be contracted and how much they will be paid. Based on budgets from the last years, it might be anything between 800 to 1700, but we will try to keep the cost around 1000 EUR.
- Each participant will get free drinks, a piece of cake and a little present. We plan to spend around 4 EUR per participant, possibly less. The idea is to make some money also for people paying half price, so 5 EUR should be the maximum cost.
- The expected cost factors are expressed as relatively standard low to mid confidence distributions.
Answers provided by the Model
The basic equation from the ArianeLogiX Thread is executed a first time with input values for the variables which are randomly sampled according to the above specified uncertainty distributions. We get one result.
We repeat the same basic equation, but now we randomly sample different input parameters. We get a second result. Is it any “better” than the first? No – it only is different.
We do this again… and again… and again… 1000 times (or more). Each iteration (individual calculation) uses a different set of input parameters. We get 1000 different results. This is called the Monte Carlo method.
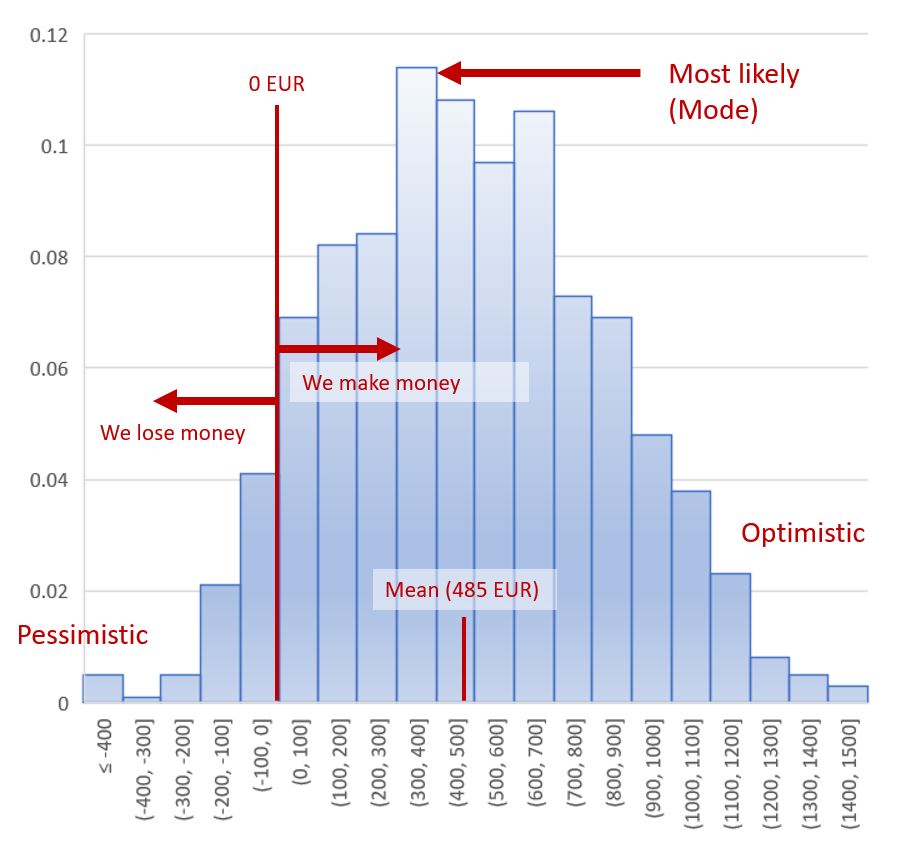
Histogram
The results from all 1000 iterations can be plotted in a histogram. Results are grouped in bins (e.g., benefit between 100 and 200 EUR), and each bin is represented by a bar with a height corresponding to the frequency (number of iterations falling within the bin divided by total number of iterations).
- A histogram is a very good graphical representation of the possible outcomes. It is intuitive to analyze.
- The peak of the histogram points us to the most frequently occurring results (the most likely benefit). Careful, unless you have perfectly symmetrical histogram, the peak (or mode) does not correspond to the overall average (or mean).
- The tails correspond to the less likely pessimistic – small benefit, or even negative benefit (or loss) – and optimistic – huge benefit! – iterations.
Up to a critical number (which is low for simple assessments like this one) the more iterations have been run, the smoother the histogram will be, and the more likely it is that you have covered the full range of possible outcomes (including the extreme values).
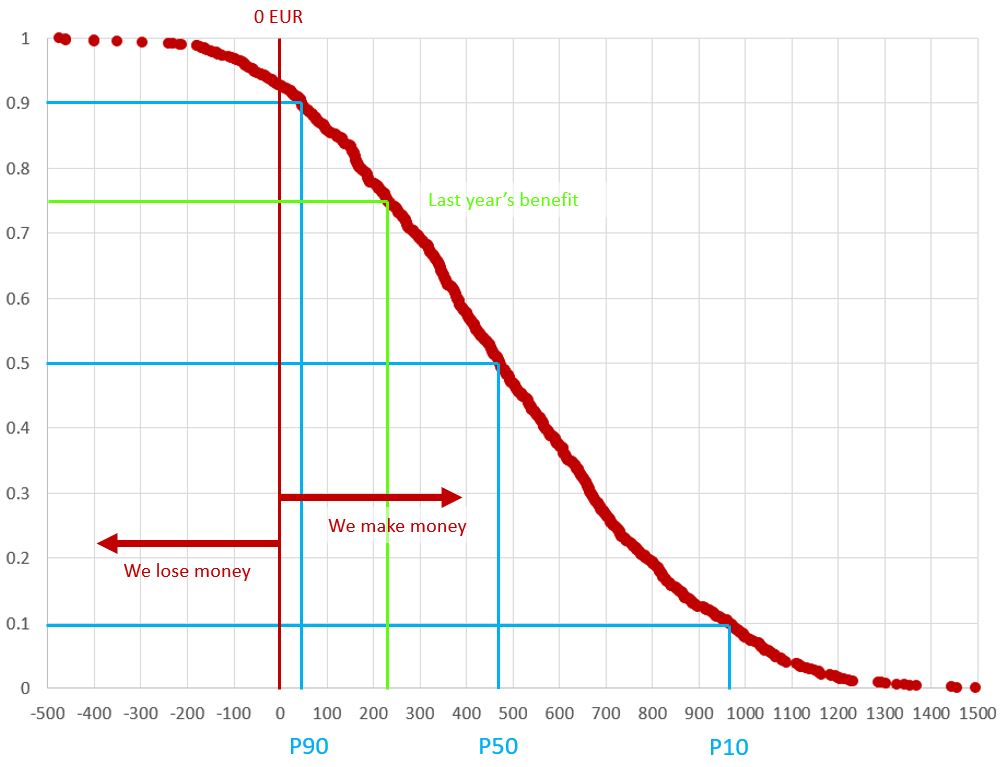
Cumulative Frequency Curves
We now arrange all 1000 results from lowest value (smallest benefit, possibly even loss) to highest value (highest benefit), and attribute them a descendent order of cumulative frequency (1 to 0). This is called an cumulative frequency exceedance curve. From that curve, we can read off likelihoods, or probabilities.
- If you cut the curve in two halves you get the median value. 50% of the results are higher than X EUR, 50% are lower, it is therefore also called P50. In other words, there is a 50% chance to generate benefits higher than 470 EUR.
- For an optimistic number, you can read off the P10 value – describing a 10% chance to achieve more than 965 EUR (or reversely, there is a 90% chance of not achieving it…).
- The P90 is often used for a more conservative estimation. You are basically saying: We are pretty sure (90%) to make at least 45 EUR.
Other percentiles (P80, P25, etc.) can be extracted from a Monte Carlo simulation. But the question can also be reverted. For a given result, see what the likelihood is (at which probability value it intersects the cumulative exceedance plot).
- No or negative benefit: There is a 7% chance (or “risk”) that we lose money.
- Exceeded objectives: There is a 75% chance we will make better than last year (230 EUR).

What the Model tells us
You can now impress the organization commission with the following statement:
“I expect (I am 80% sure that) with this year’s school event we will earn between 45 (P90) and 965 (P10), probably between 300 and 400 (most likely). It is likely (75%) that we will do better than last year (230 EUR). If it works really well, we may even get more, maybe 1065 (P5) or even 1285 EUR (P1). However, let’s be realistic and be aware that we might lose some money – in worst case 215 (P99) – even though this is not very likely (less than 10 % chance).”
Probabilistic Assessments with ArianeLogiX
With this little example, you can see that establishing a probabilistic risk model enables you to make better quantitative predictions. You also have noticed that it does not need experts to run such an assessment. It is more like an interview where you respond to questions by giving estimations of unknown parameters based on your experience.
In the above introduction, we keep the ArianeLogiX Thread simple for illustration reasons. Real world assessments tend to be (but not necessarily need to) much more complicated and are difficult to create, maintain and verify in a spreadsheet. In particular for multi-asset evaluations in a more complex domain, a robust system is needed.
With ArianeLogiX, we make assessments easy for you. Our industry-leading industry experts created best-in class web-based software with transparent domain workflows, spiced up with unique features such as the intuitive Dancing Distributions. We pave the way for your domain experts to concentrate on what the really good at (and most enjoy!).
Explore your Opportunities
- For your assessments of Exploration & Appraisal Assets, ask us about our software Ariane. The first release is planned for April 2021. We also have advanced in-house modules we use in training and consultancy.
- Creating a robust probabilistic assessment is all about linking domain knowledge in a comprehensive environment. You know the logic and the nature of the uncertainty in your business better than anybody else. Customize your proprietary “Ariane’s Thread”.
- Finally, get to know our vision for the Energy Transition.