
- We believe that the optimal people to perform technical work are those who first of all understand the specific domain. Very few of those domain experts have the dual skills to also master in full detail the mathematics behind the methodologies and tools they are using. This is not an issue as long as trusted assessment software is used, with a domain front-end and a verified robust scientific core.
- With ArianeLogiX, the users can concentrate on applying their expertise using transparent assessment workflows designed by peer domain experts. Our unique set of distributions are one part of this philosophy. Using comprehensive parameters, the assessors can “make the distribution dance” until it reflects their perception of uncertainty ranges.
- The Dancing Distributions are a result of collaboration with our Advisors Prof. Jan de Jager, PhD, and Prof. Dr. Arnold Neumaier. Jan was risk advisor for a major international energy company ensuring consistency in assessment methodologies, in particular in the way uncertainty distributions were used. As an applied mathematician, Arnold wrote risk and uncertainty programs for various governmental and industry entities.
How do the Dancing Distributions work?
All Dancing Distributions work with parameters which are easy to understand.
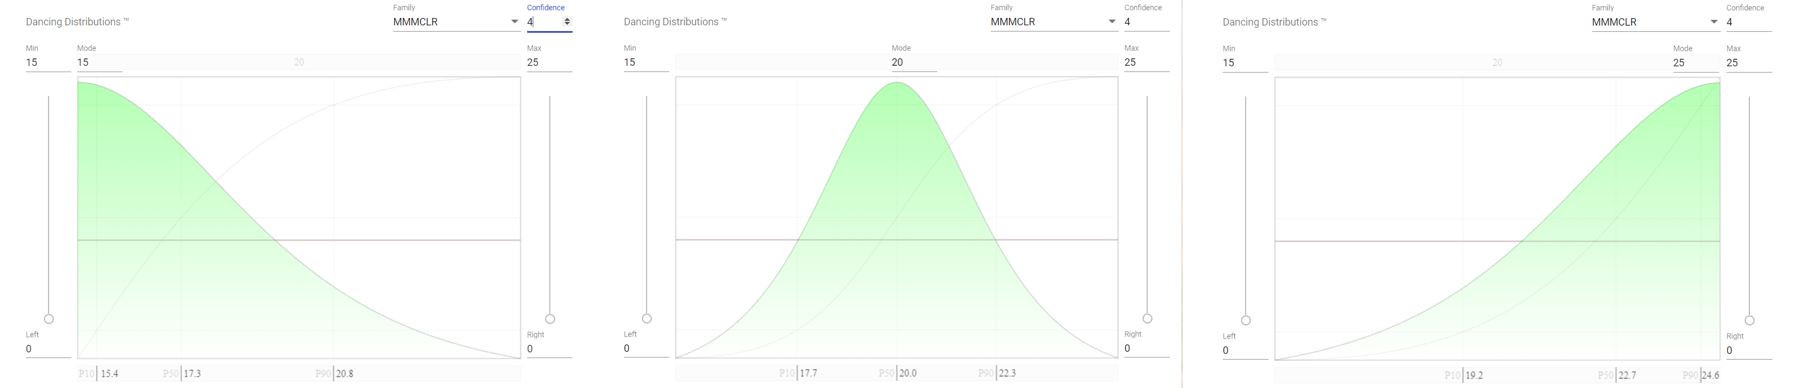
- Direct minimum, mode and maximum values structure the distribution limits. Distributions can be asymmetrical or even completely one-sided (e.g., mode equals min)
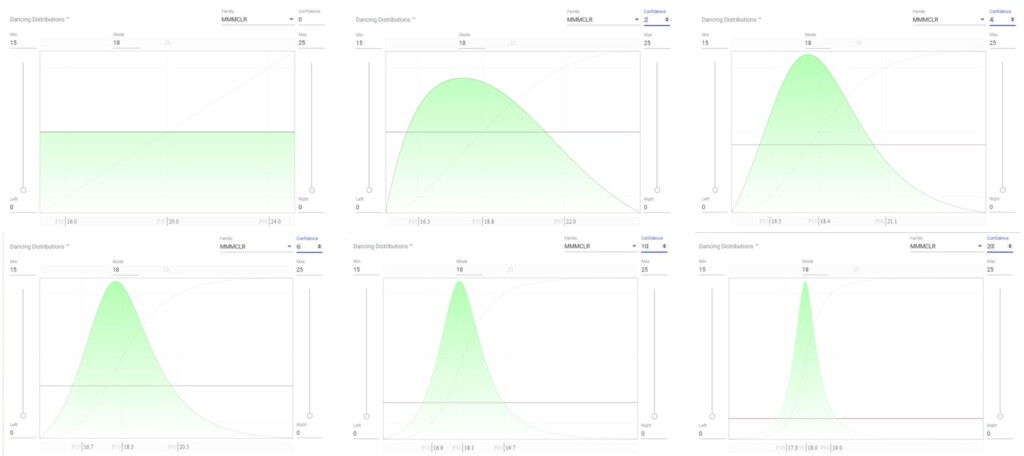
- A confidence factor describes the height of the mode with respect to the tails. At zero confidence the distribution is uniform, with increasing confidence more weight is attributed to the mode, and high confidence values create a distribution tending towards constant.
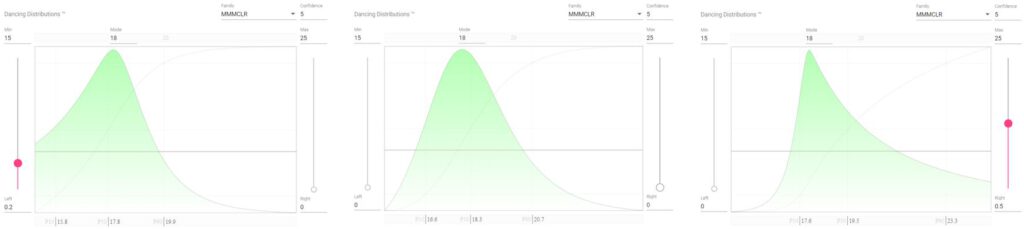
- Sampling of extreme values within the distribution tails will always be honored. Optionally, min and max can be inflated.
With those few parameters, any reasonable uncertainty distribution shape can be expressed with a single distribution type, our Dancing Distribution. Specific percentiles can be extracted, e.g., to validate P90 or P10 values. Dancing Distributions of any shape can be mathematically correlated.